小数今天给大家分享几组Nature中的配色方案,学学大佬们的图都是怎么配色的。

1.配色方案一


library(tidyverse)
data = readxl::read_xlsx("./data/MOESM21_ESM.xlsx")
data %>%
pivot_longer(-c(Condition, Lineage),
names_to = "obs", values_to = "Number of cells")-> df
##Figure01
pal = c("#f9eb77", "#04ced1", "#ed51d0")
ggplot(data = df,
aes(x=Lineage, y=`Number of cells`))+
geom_bar(aes(fill = Lineage),
stat = "summary", fun="mean", color="grey20", width = 0.75)+
stat_summary(geom = "errorbar", fun.data = "mean_se",
width=0.25)+
geom_jitter(width = 0.3, shape=21, color="grey20", fill="white", size=2, stroke=1)+
scale_x_discrete(limits = c("EPI", "TE", "PrE"))+
scale_y_continuous(limits = c(0, 300),
breaks = seq(0, 300, 100),
expand = c(0, 0))+
scale_fill_manual(values = pal,
limits = c("EPI", "TE", "PrE"),
guide = "none")+
guides(y = guide_axis(cap = "upper"))+
facet_wrap(~Condition, axes = "margins", strip.position = "bottom")+
theme_classic()+
theme(strip.placement = "outside",
strip.background = element_rect(color = NA),
axis.title.x = element_blank())
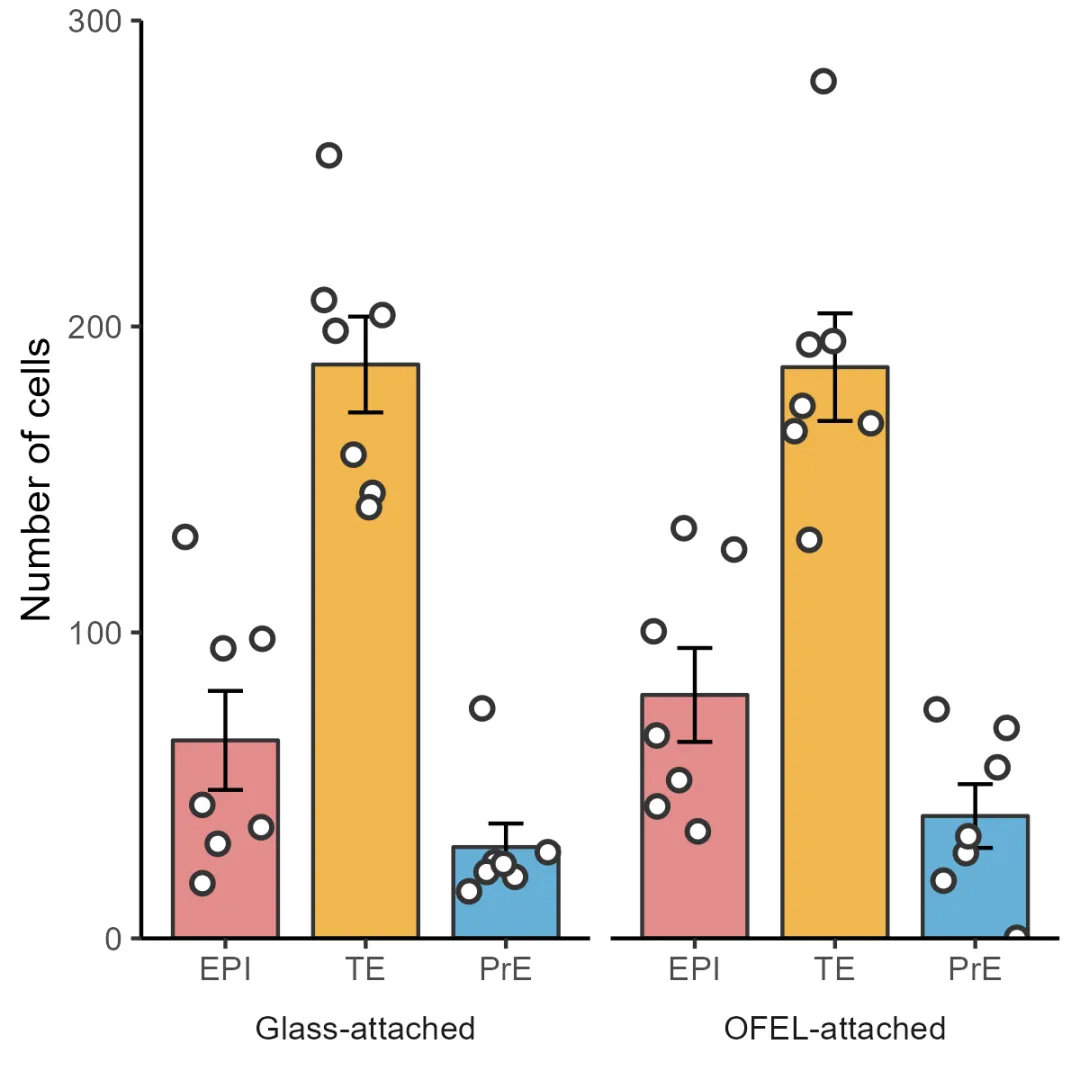
2.配色方案二


pal = c("#e38d8c", "#f1b74e", "#66b0d7")
ggplot(data = df,
aes(x=Lineage, y=`Number of cells`))+
geom_bar(aes(fill = Lineage),
stat = "summary", fun="mean", color="grey20", width = 0.75)+
stat_summary(geom = "errorbar", fun.data = "mean_se",
width=0.25)+
geom_jitter(width = 0.3, shape=21, color="grey20", fill="white", size=2, stroke=1)+
scale_x_discrete(limits = c("EPI", "TE", "PrE"))+
scale_y_continuous(limits = c(0, 300),
breaks = seq(0, 300, 100),
expand = c(0, 0))+
scale_fill_manual(values = pal,
limits = c("EPI", "TE", "PrE"),
guide = "none")+
guides(y = guide_axis(cap = "upper"))+
facet_wrap(~Condition, axes = "margins", strip.position = "bottom")+
theme_classic()+
theme(strip.placement = "outside",
strip.background = element_rect(color = NA),
axis.title.x = element_blank())
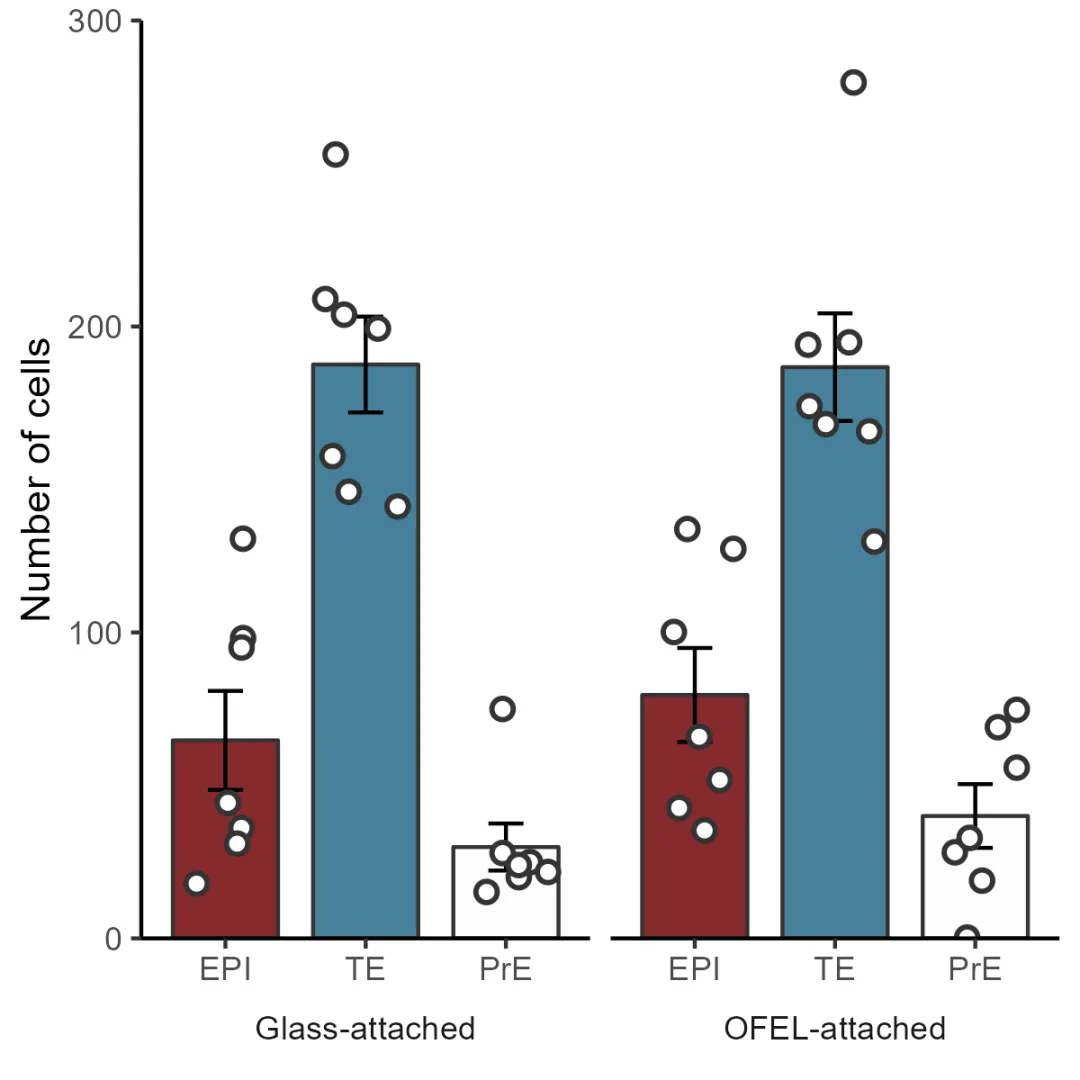
3.配色方案三


pal = c("#862a2d", "#468099", "#fcfcfc")
ggplot(data = df,
aes(x=Lineage, y=`Number of cells`))+
geom_bar(aes(fill = Lineage),
stat = "summary", fun="mean", color="grey20", width = 0.75)+
stat_summary(geom = "errorbar", fun.data = "mean_se",
width=0.25)+
geom_jitter(width = 0.3, shape=21, color="grey20", fill="white", size=2, stroke=1)+
scale_x_discrete(limits = c("EPI", "TE", "PrE"))+
scale_y_continuous(limits = c(0, 300),
breaks = seq(0, 300, 100),
expand = c(0, 0))+
scale_fill_manual(values = pal,
limits = c("EPI", "TE", "PrE"),
guide = "none")+
guides(y = guide_axis(cap = "upper"))+
facet_wrap(~Condition, axes = "margins", strip.position = "bottom")+
theme_classic()+
theme(strip.placement = "outside",
strip.background = element_rect(color = NA),
axis.title.x = element_blank())


